Understanding Bitcoin Money Flow: How Capital Moves Through Crypto Markets
Posted on D2Crypto.Xyz | May 18, 2025
The cryptocurrency market is a dynamic ecosystem where capital flows like a river, shifting between assets based on market sentiment, trends, and investor behavior. At the heart of this ecosystem lies Bitcoin (BTC), often considered the gateway to crypto investing. But where does the money go after it enters Bitcoin? In this blog, we’ll dive into the Bitcoin money flow, explore how capital moves from BTC to Ethereum (ETH) and altcoins, and visualize these trends with insightful graphs. Whether you’re a seasoned trader or a crypto newbie, understanding these flows can help you navigate the market like a pro.
What is Bitcoin Money Flow?
Bitcoin money flow refers to the movement of capital into, out of, and through Bitcoin as it interacts with other cryptocurrencies and the broader market. Think of Bitcoin as the primary on-ramp for fiat currency (like USD, EUR) entering the crypto space. Once in Bitcoin, this capital often doesn’t stay put—it flows to other assets like Ethereum and altcoins, driven by market cycles, investor risk appetite, and profit-taking opportunities.
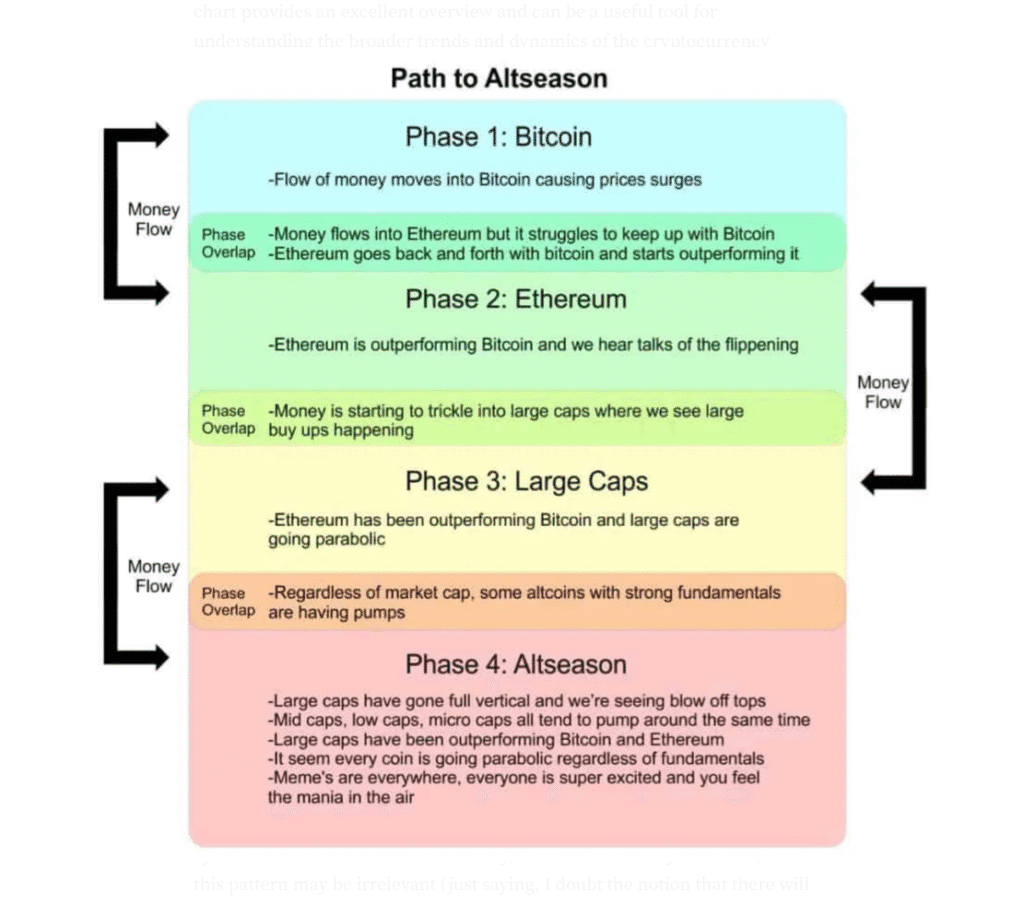
This flow isn’t random. It follows a predictable pattern known as the Crypto Money Flow Cycle, where money typically:
- Enters the market via Bitcoin.
- Moves to Ethereum as investors seek exposure to smart contract platforms.
- Spreads to large-cap altcoins (e.g., BNB, ADA, SOL) and smaller altcoins or memecoins.
- Eventually exits back to Bitcoin or fiat during market corrections or profit-taking phases.
Understanding this cycle can help you anticipate market trends and position your portfolio strategically. Let’s break down each stage and visualize the flow with some key graphs.
Stage 1: Fiat to Bitcoin – The Market Gateway
Bitcoin is the most liquid and widely recognized cryptocurrency, making it the primary entry point for new capital. Investors typically convert fiat currency to BTC on exchanges like Coinbase, Binance, or Kraken. This influx is often tracked through Bitcoin Exchange Netflow, which measures the difference between coins flowing into and out of exchange wallets. A positive netflow (more BTC entering exchanges) can signal selling pressure, while a negative netflow (more BTC leaving) suggests accumulation or holding.
Graph Idea: Bitcoin Exchange Netflow
- Description: A line graph showing Bitcoin Exchange Netflow (in BTC) over the past 12 months, sourced from platforms like CryptoQuant or Glassnode.
- What to Look For: Spikes in positive netflow during market tops (selling) and negative netflow during accumulation phases (bullish sentiment).
- How to Create: Use CryptoQuant’s “Bitcoin: Exchange Netflow (Total)” dataset or a similar tool. Plot daily or weekly netflow values with key market events (e.g., Bitcoin halving, ETF approvals) marked for context.
Source Suggestion: Check out CryptoQuant’s Bitcoin Exchange Flows for real-time data to build this graph.
Stage 2: Bitcoin to Ethereum – The Smart Contract Shift
Once Bitcoin rallies and investor confidence grows, capital often flows into Ethereum (ETH). Why? Ethereum powers decentralized finance (DeFi), non-fungible tokens (NFTs), and layer-1 scaling solutions, making it a hub for innovation and higher-risk, higher-reward opportunities. This shift is especially pronounced during “altcoin season,” when ETH and other altcoins outperform Bitcoin.
The ETH/BTC ratio is a key indicator of this flow. When the ratio rises, it suggests capital is moving from Bitcoin to Ethereum, as ETH gains value relative to BTC. Posts on X have highlighted this pattern, noting that money often “flows into ETH” after BTC as investors chase growth in smart contract ecosystems.
Graph Idea: ETH/BTC Ratio
- Description: A candlestick or line graph showing the ETH/BTC trading pair’s price movement over the past 24 months.
- What to Look For: Uptrends in the ETH/BTC ratio indicate capital flowing from Bitcoin to Ethereum, often signaling the start of altcoin season.
- How to Create: Pull historical ETH/BTC data from TradingView or CoinDesk’s data platform. Annotate periods of significant ETH outperformance (e.g., early 2025 DeFi boom).
Source Suggestion: Explore CoinDesk’s ETH/BTC Ratio Chart for historical insights.
Stage 3: Ethereum to Altcoins – The Altcoin Season Surge
As Ethereum rallies, investor risk appetite increases, and capital flows into altcoins—everything from large-cap layer-1s like Solana (SOL) and Cardano (ADA) to small-cap tokens and memecoins. This phase, often called “altcoin season,” sees smaller projects skyrocket as traders seek outsized returns. The CMC Altcoin Season Index on CoinMarketCap tracks this trend, measuring whether altcoins are outperforming Bitcoin.
Recent market data supports this pattern. For example, Bitwise Investments noted that in late 2024, altcoins surged as Bitcoin’s rally stalled, with investors rotating into Ethereum-based funds and other altcoins. This flow is driven by Ethereum’s role as a sentiment indicator for the broader altcoin market, as its performance often sets the tone for smaller tokens.
Graph Idea: Altcoin Market Cap vs. Bitcoin Dominance
- Description: A dual-axis chart comparing total altcoin market capitalization (excluding BTC) against Bitcoin’s dominance percentage (BTC’s share of total crypto market cap).
- What to Look For: Rising altcoin market cap alongside declining Bitcoin dominance signals capital flowing into altcoins, typical of altcoin season.
- How to Create: Use TradingView’s “Crypto Market Cap Charts” or CoinMarketCap data to plot altcoin market cap and Bitcoin dominance over 12–24 months. Highlight periods of altcoin outperformance.
Source Suggestion: Visit TradingView’s Crypto Market Cap Charts or CoinMarketCap’s Altcoin Season Index for data.
Stage 4: Altcoins Back to Bitcoin or Fiat – The Exit Strategy
Eventually, the market cycle peaks, and capital flows back to Bitcoin or exits to fiat. This happens during profit-taking, market corrections, or bearish sentiment. Investors often move funds to Bitcoin as a “safe haven” within crypto before converting to stablecoins or fiat. This reverse flow is visible in Bitcoin’s market dominance, which tends to rise during market downturns as altcoins lose value faster than BTC.
Graph Idea: Bitcoin Dominance Over Time
- Description: A line graph showing Bitcoin’s dominance percentage over the past 24 months.
- What to Look For: Spikes in dominance during market corrections indicate capital flowing back to Bitcoin from altcoins.
- How to Create: Source data from CoinMarketCap or CoinGecko and plot dominance alongside key market events (e.g., 2022 bear market, 2025 rally).
Source Suggestion: Check CoinMarketCap’s Market Trends for dominance data.
Why Understanding Money Flow Matters
The Bitcoin money flow cycle isn’t just a theoretical model—it’s a roadmap for navigating crypto markets. By tracking where capital is moving, you can:
- Time your entries and exits: Buy Bitcoin during accumulation phases, shift to ETH or altcoins during rallies, and secure profits in BTC or fiat before corrections.
- Gauge market sentiment: Rising ETH/BTC ratios or altcoin market caps signal growing risk appetite, while increasing Bitcoin dominance suggests caution.
- Diversify strategically: Understanding flow patterns helps you allocate across BTC, ETH, and altcoins based on market conditions.
Tools to Track Money Flow
To stay ahead of the curve, use these platforms to monitor Bitcoin money flow and market trends:
- CryptoQuant: For exchange netflow and on-chain data.
- TradingView: For ETH/BTC ratio and market cap charts.
- CoinMarketCap: For altcoin season index and dominance trends.
- Glassnode: For advanced on-chain analytics (subscription-based).
- The Block: For crypto flow data and charts.
Conclusion: Ride the Flow with D2Crypto.Xyz
The crypto market is a game of flows, and Bitcoin is the starting line. By understanding how money moves from BTC to Ethereum, altcoins, and back, you can make informed decisions and capitalize on market cycles. Keep an eye on key indicators like exchange netflows, the ETH/BTC ratio, altcoin market cap, and Bitcoin dominance—and let the graphs guide your strategy.
At D2Crypto.Xyz, we’re here to empower you with the insights and tools you need to thrive in crypto. Stay tuned for more market analysis, trading tips, and data-driven content. What’s your take on the current money flow? Are we heading into altcoin season, or is Bitcoin still king?
Follow D2Crypto.Xyz for the latest crypto insights, and happy trading!